
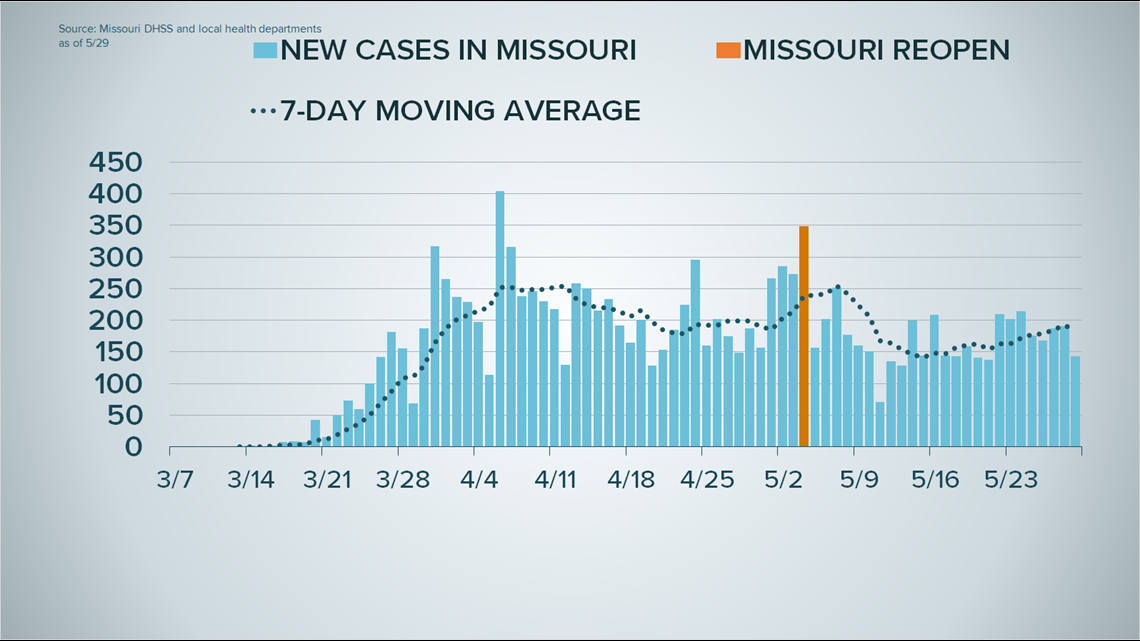
JEFFERSON CITY, Mo. — The Missouri Department of Health and Senior Services reported 122 additional COVID-19 cases Friday.
The department reported a total of 12,795 cases and 738 deaths Friday, an increase of 122 cases and 31 deaths.
Of the new deaths reported by the state Friday, 20 of them were in St. Louis County.
The state also reported an increase of 6,807 new PCR tests, bringing the state’s total to 177,671.
The single-day case increases over the last week were:
- 181 on Thursday
- 201 on Wednesday
- 124 on Tuesday
- 179 on Monday
- 236 on Sunday
- 194 on Saturday
The positivity rate in the state decreased to 7.1% Friday, down from 7.42% on Thursday. The rate has dropped each day since the state made changes to the way it reports testing data.

St. Louis and St. Louis County account for more than half of the cases and deaths in the state. St. Louis County has the highest number of cases(4,914) and deaths(415) of any county in the state, but St. Louis city has a higher rate of cases.
St. Louis has the highest rate of COVID-19 in the area with 637 per 100,000, but there are three counties in the state with higher rates. Saline County has the highest with 1,173 per 100,000 followed by Sullivan at 903 and Buchanan with 786.
The age breakdown for state-reported cases as of Friday was:
- Under 20 511
- 20-24 796
- 25-29 972
- 30-34 909
- 35-39 875
- 40-44 886
- 45-49 1,013
- 50-54 1,058
- 55-59 1,084
- 60-64 827
- 65-69 1,129
- 70-74 691
- 75-79 538
- 80+ 1,495
The age breakdown for state-reported deaths as of Friday was:
- Under 20 0
- 20-29 1
- 30-39 3
- 40-49 15
- 50-59 46
- 60-69 123
- 70-79 191
- 80+ 359
For a full county-by-county breakdown, use the interactive map below: