ST. LOUIS — In just a few days, St. Louis and St. Louis County will begin loosening restrictions put in place to limit the spread of the coronavirus.
On May 18, certain businesses will be allowed to reopen for the first time since St. Louis County Executive Sam Page and St. Louis Mayor Lyda Krewson installed stay-at-home orders.
RELATED: Masks, barriers and handwashing | St. Louis releases specifics on phase 1 of reopening plan
At the time those orders were put in place, St. Louis and St. Louis County had a total of 112 confirmed cases of COVID-19. In the 52 days since then, more than 5,000 new cases have been confirmed and 400 people have died.
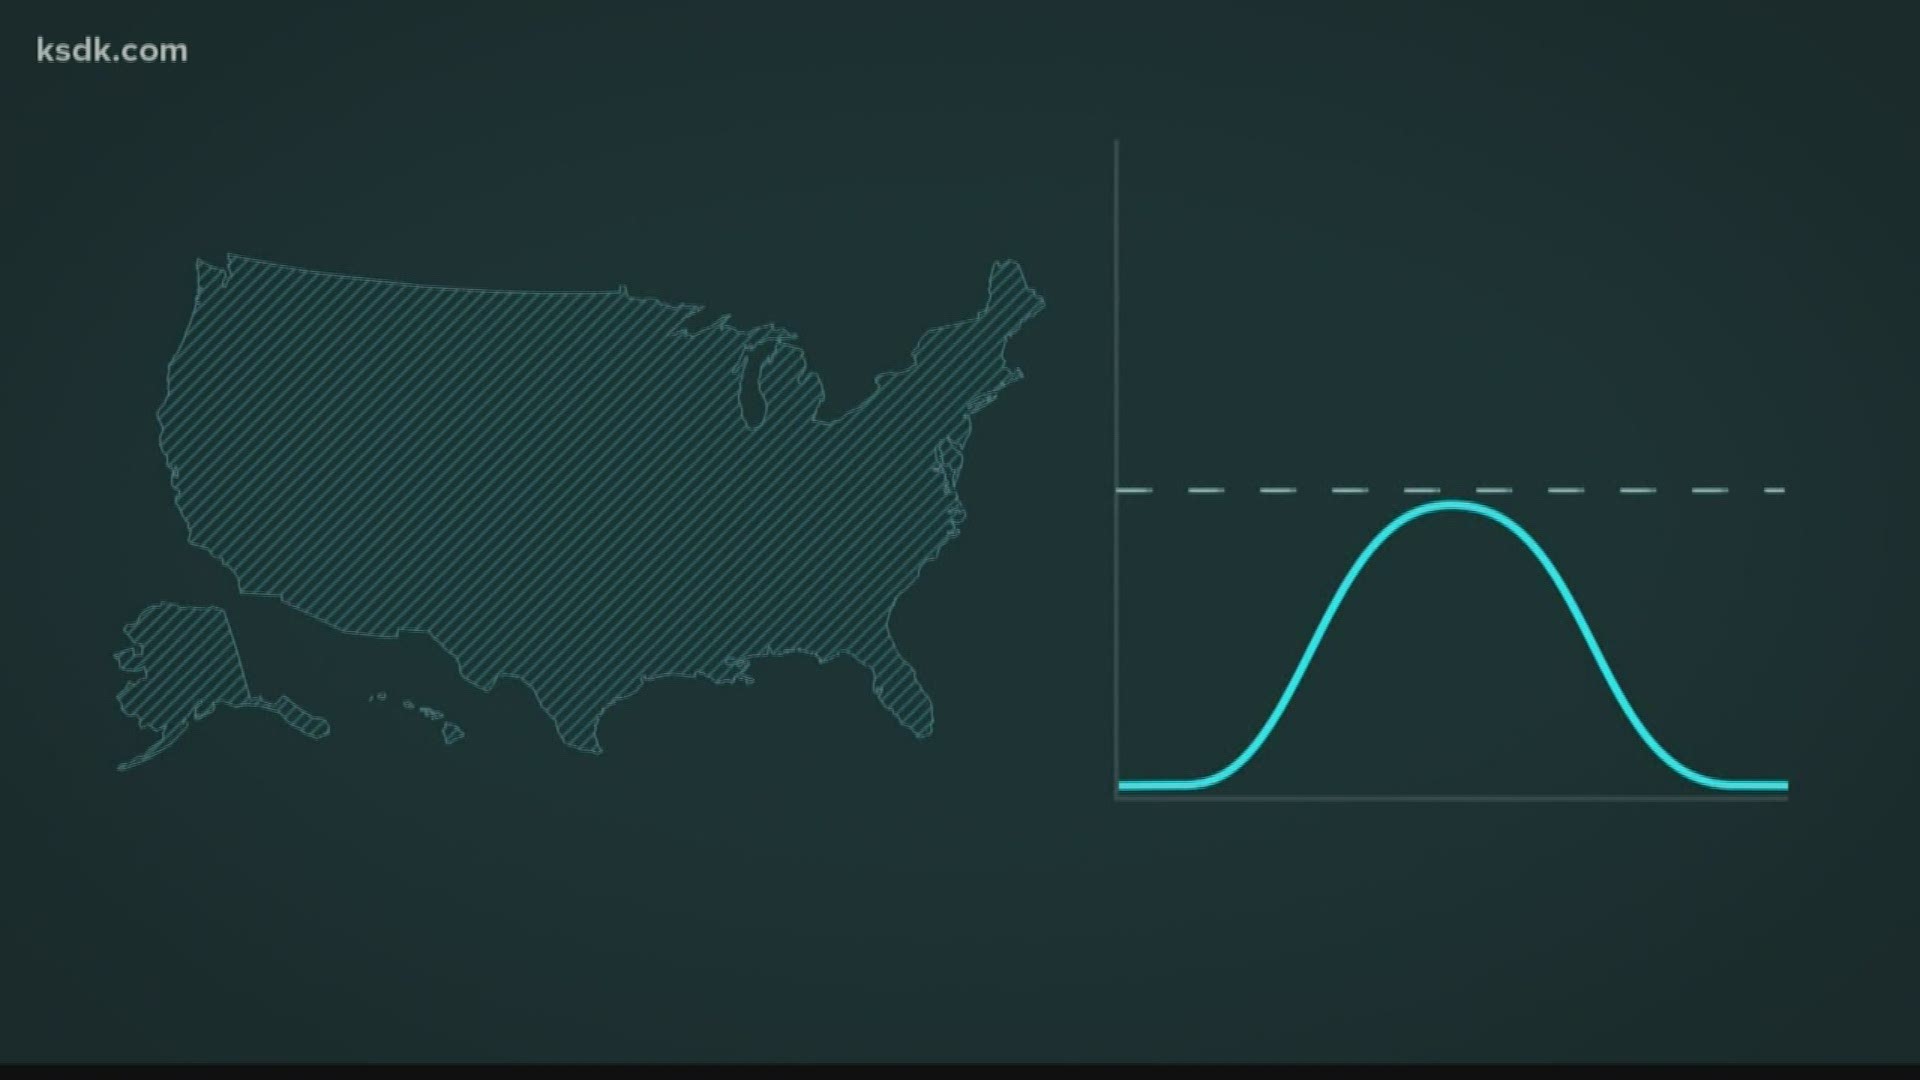
It can be tough to see at the moment, but while the numbers may have increased significantly, the measures put in place and the actions that were taken by people in the city and county helped flatten the curve.
One way to see that is by looking at the various "curves," starting with when the orders were put in place.
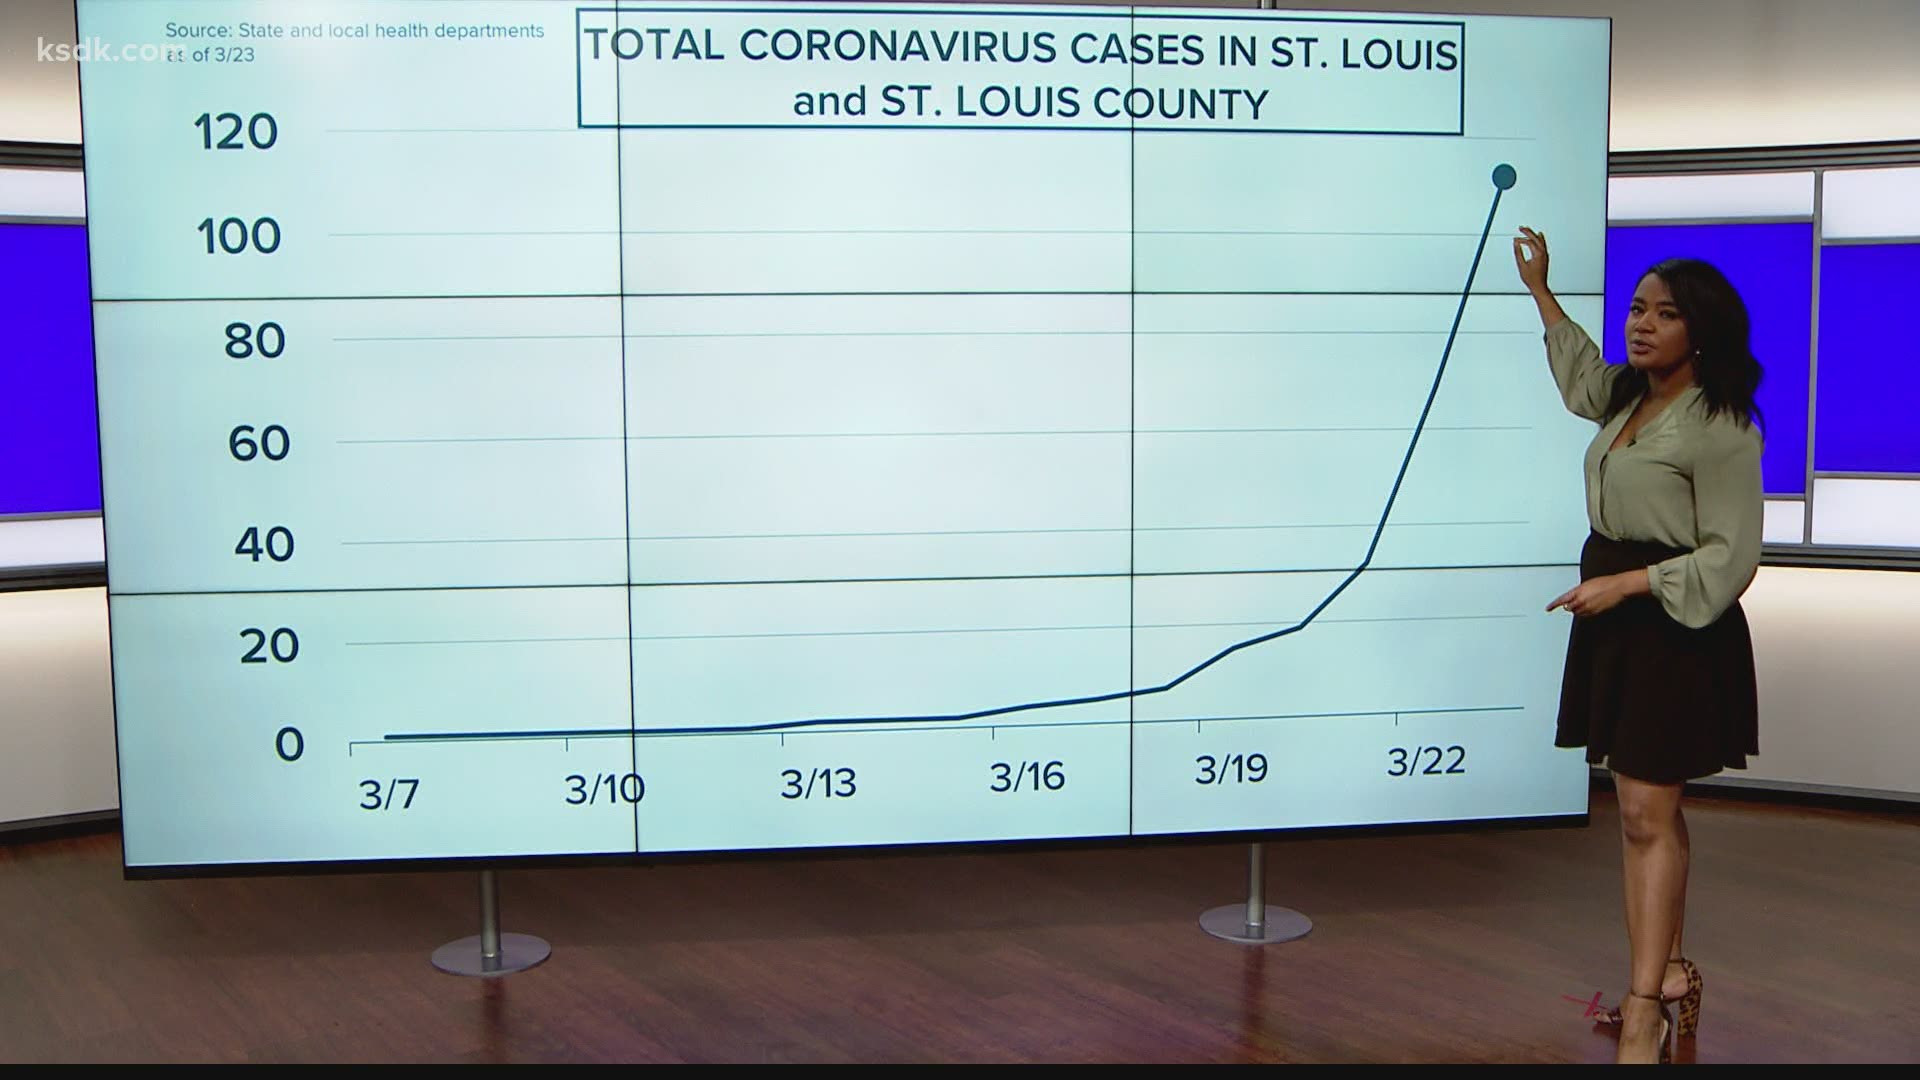
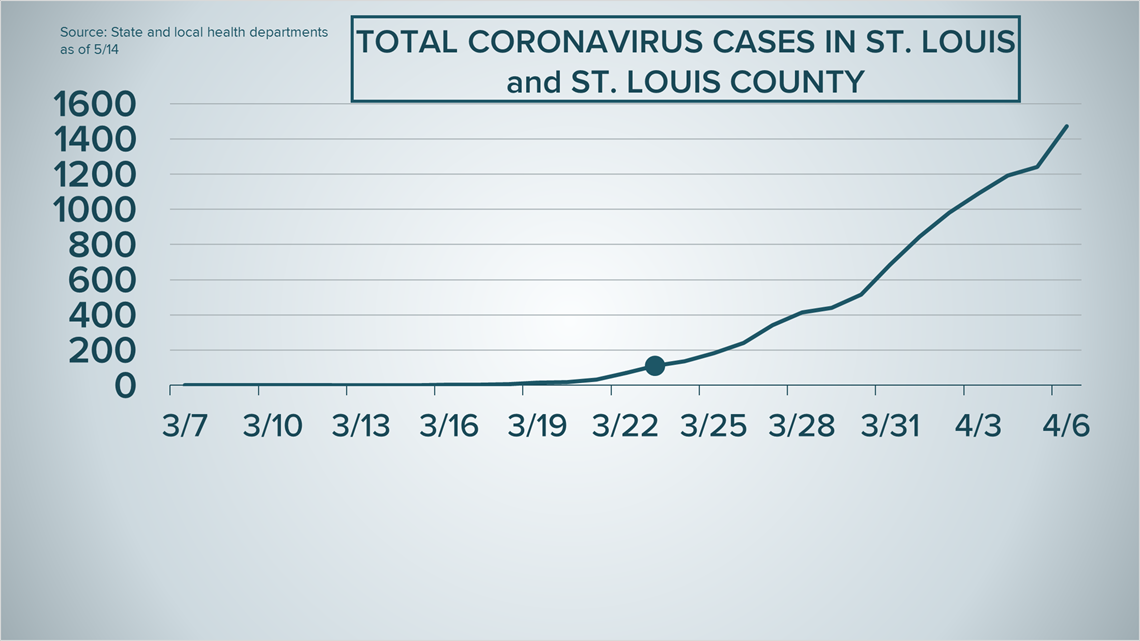
March 23 – 112 total cases

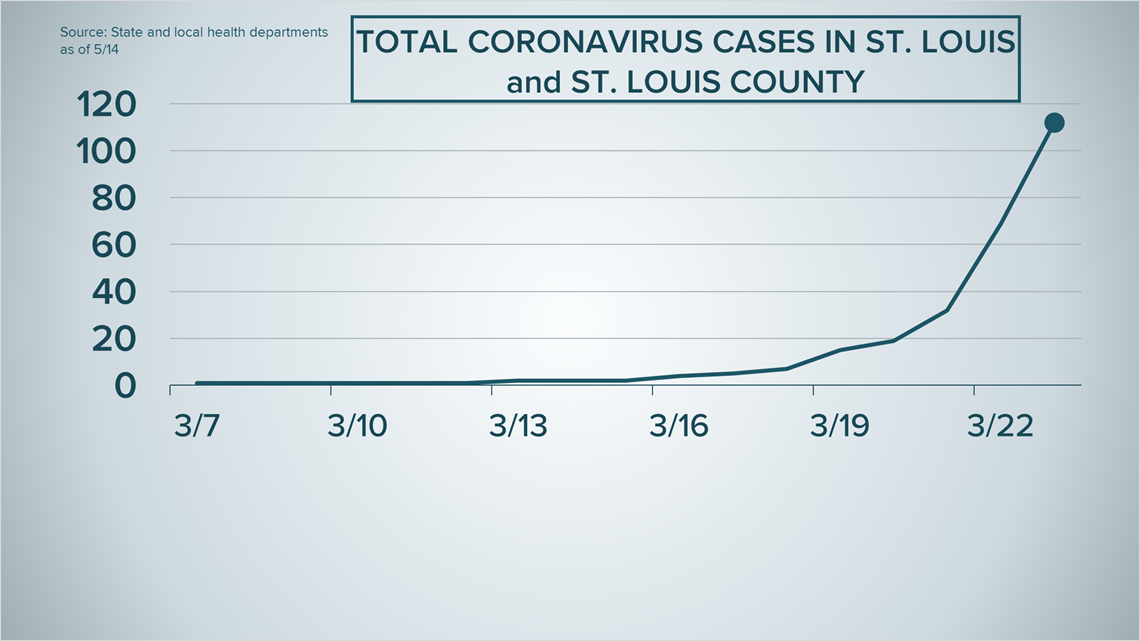
In order to figure out if the curve has flattened, you have to start with a curve. While the total number of cases on March 23 was not that high, the trend was concerning. The number of cases went from:
- 15 on March 19
- 19 on March 20
- 32 on March 21
- 69 on March 22
- 122 on March 23
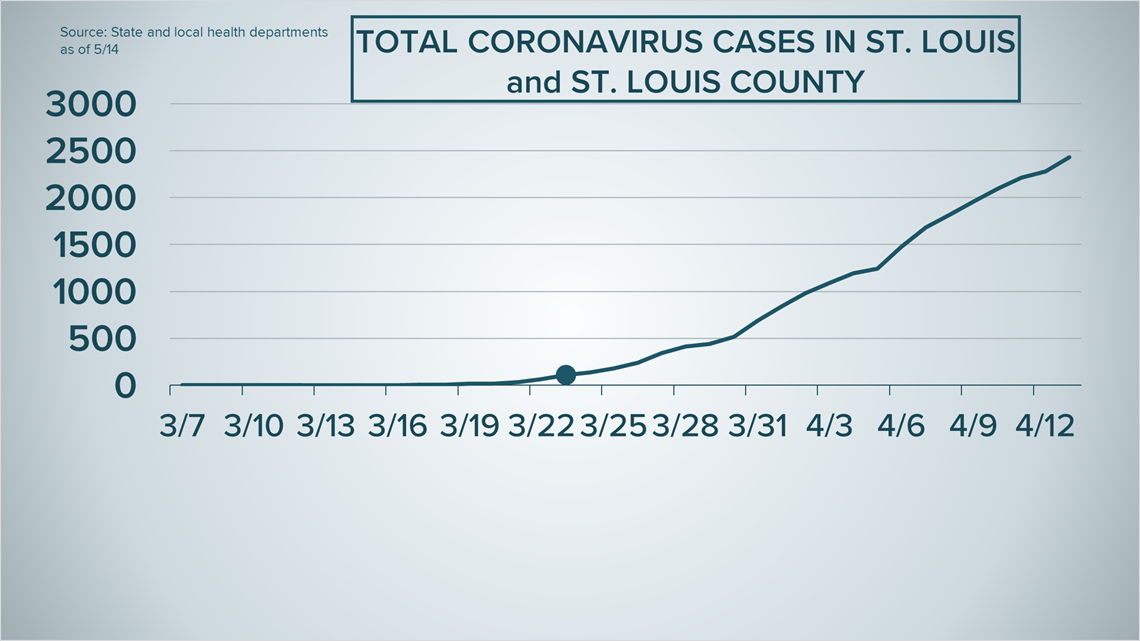
March 30 – 516 cases

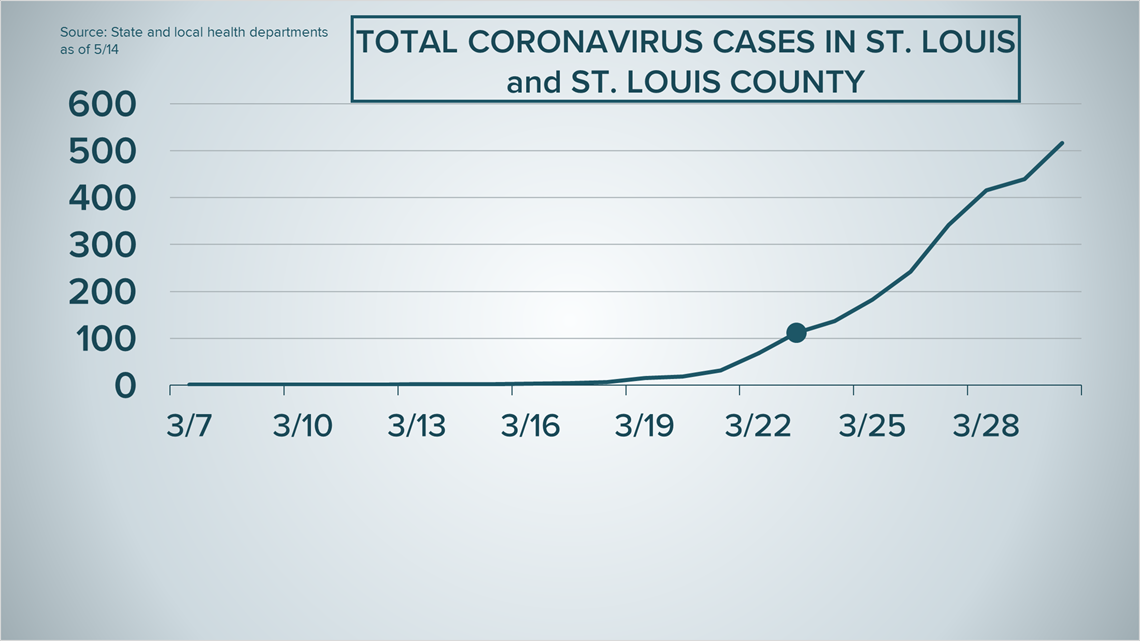
Jump ahead seven days, and the numbers had more than quadrupled.
Leaders and medical experts said social distancing efforts could take about 14 days before results started showing up, so it is not surprising that the rate of increase continued.
April 6 – 1,473 cases

Week 2 of the order, days 8-14, the number of cases almost tripled. That's still very quick growth, but not as high as the previous week.
It's not so obvious at this point, but the curve starting to flatten.
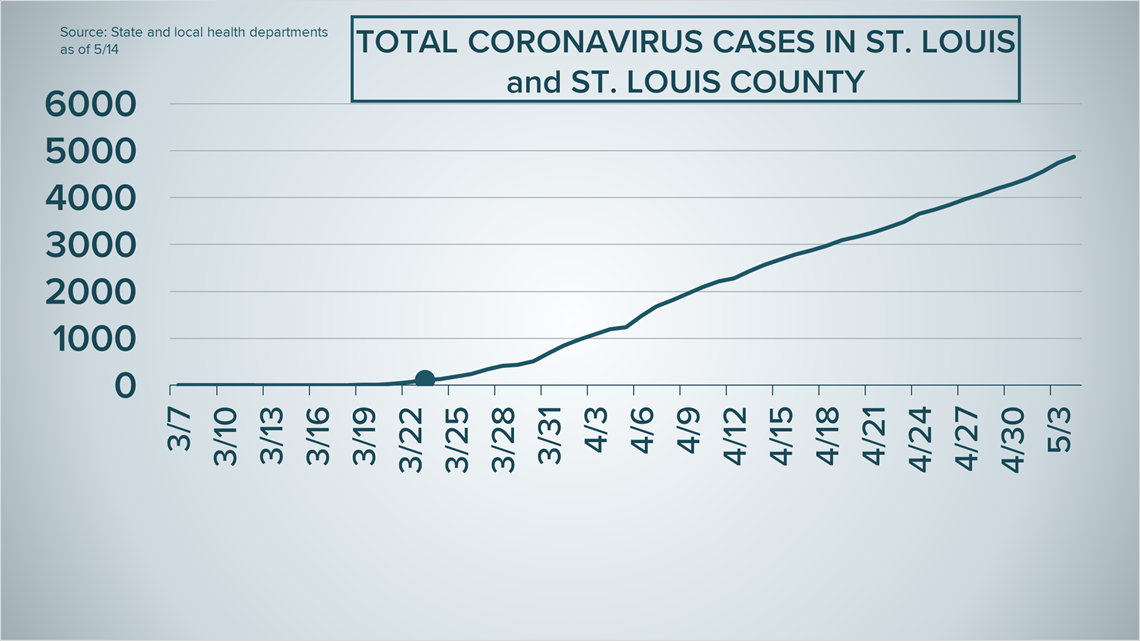
April 13 – 2,430 cases

Most medical experts said it would be about 14 days before the results of the social distancing measures would really show meaningful results, and these numbers bear that out.
From days 15-21 the total number of cases didn’t even double.
In order for the numbers to double again, it would take another 21 days.
May 4 – 4,867 cases

By the time the cases doubled again, it was May 4, the same day Missouri Governor Mike Parson started the state's reopening.
May 14 – 5,700 cases

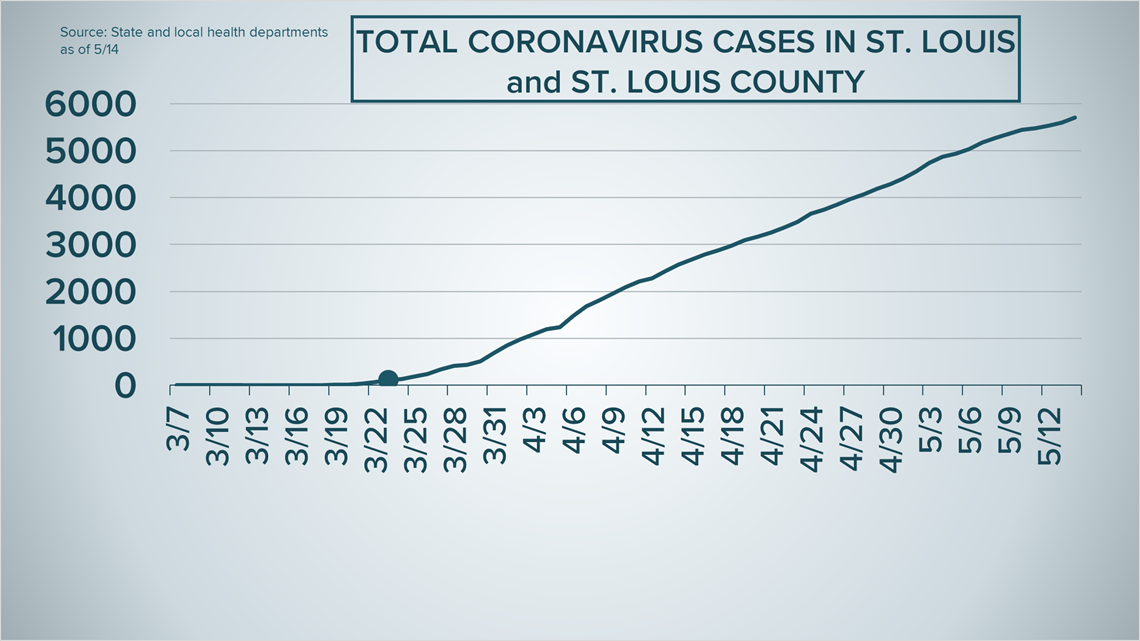
It’s been 10 days since that last doubling, and in those 10 days, the total has increased by 17%.
With the curve flattened significantly, we will have to wait to see how long it will take for the cases to double again, which is undoubtedly good news.
These numbers don’t even factor in an increase in testing capacity that almost certainly occurred over this time because St. Louis and St. Louis County do not provide raw testing numbers.
What the numbers do show, though, is that the actions of the people in St. Louis and St. Louis County flattened the curve over the last 52 days, which reduced the number of people getting sick, kept hospitals from being overrun and helped save lives.